The True Cost of GPU Ownership: Computing Run Costs for Self-Hosted AI Infrastructure
Choosing which GPU to build your infrastructure around is a multi-year commitment. Cloud rental prices make this decision harder, not easier—they're driven by supply and demand cycles that have little to do with the underlying hardware economics.
What you actually need is the true operational cost: what it costs to own and run GPU hardware, independent of market dynamics. This stable baseline allows you to evaluate whether self-hosting makes sense for your workloads, compare different GPU classes on an apples-to-apples basis, and make informed long-term infrastructure decisions.
In this guide, we break down every component of GPU run cost—electricity, depreciation, financing, maintenance, and facility overhead to arrive at a stable $/GPU-hour figure for each GPU class.
This model estimates costs for a medium-sized company using a colocation facility with average commercial electricity rates. Hyperscalers (Google, Meta, etc.) operate very differently—they can build dedicated AI factories with on-site power generation, negotiate significant hardware discounts, access cheap capital (5-10% vs our 20%), and achieve operational efficiencies at scale. Their true run costs could be 30-50% lower than what we estimate here.
Estimates from this report are based on publicly available data as of January 2026 and conversations with data center operators that leverage CloudRift platform. Actual costs will vary based on location, hardware pricing, financing terms, and operational practices.
The six components of GPU run cost
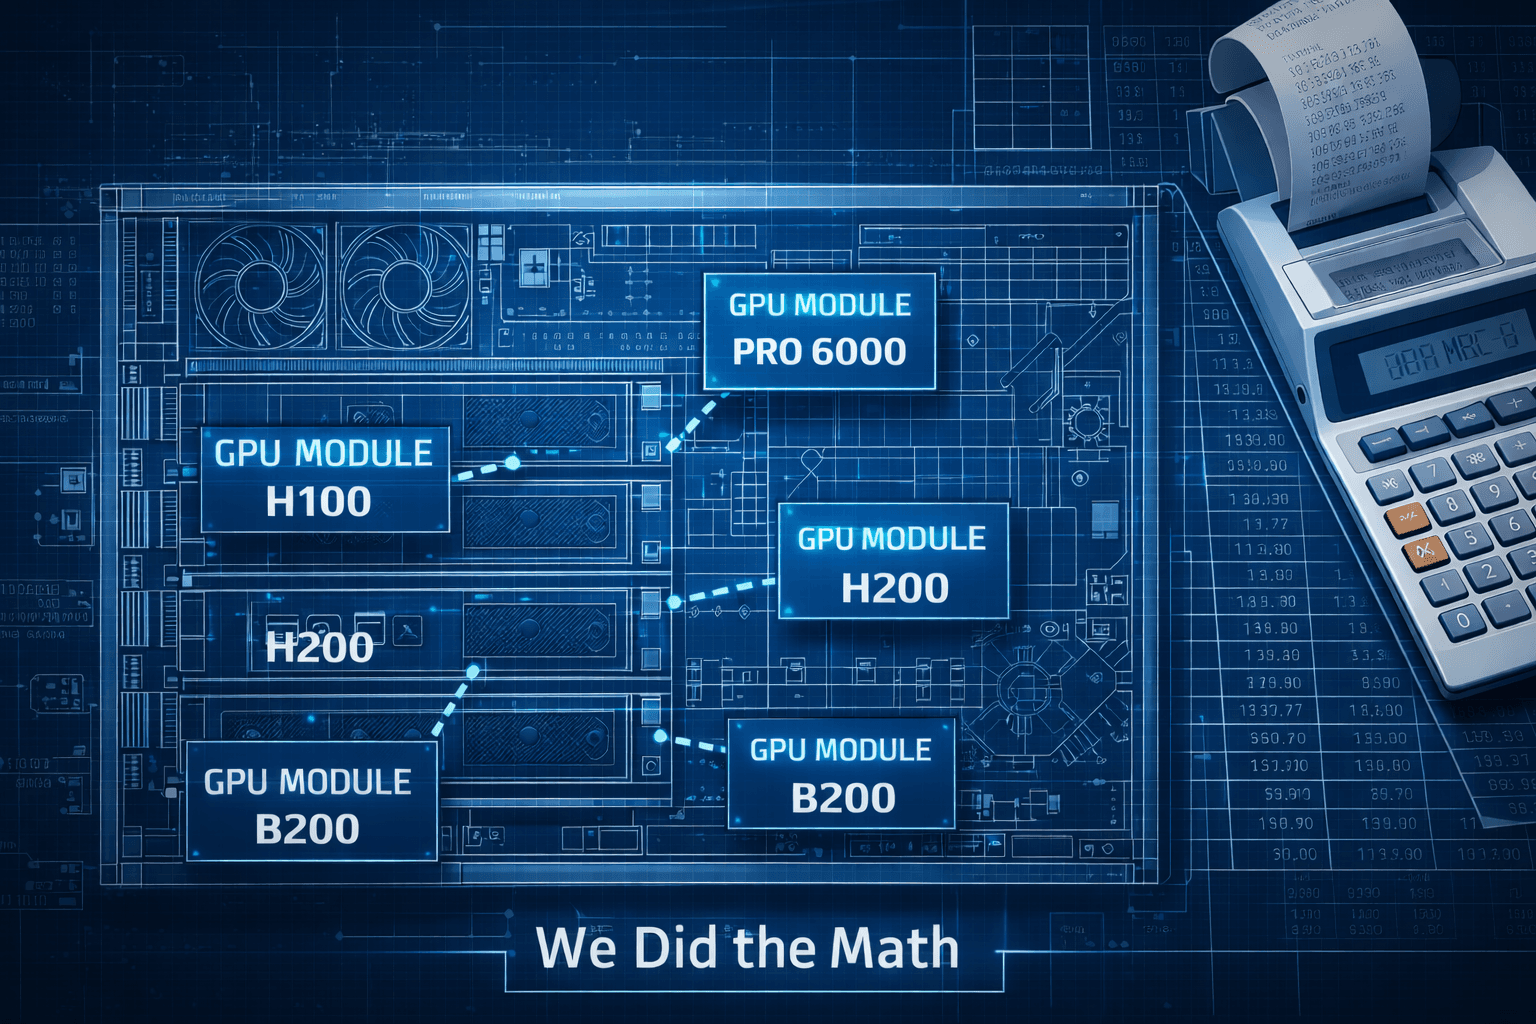
We break down GPU run cost into six key components and estimate each one for four popular GPU classes: NVIDIA RTX PRO 6000 SE, NVIDIA H100, NVIDIA H200, and NVIDIA DGX B200. The estimates below assume a full 8-GPU system for each GPU type.
1. Electricity
GPU systems consume significant power, and you pay not just for compute but for cooling and facility overhead. We account for this using PUE (Power Usage Effectiveness)—the ratio of total facility power to IT equipment power. A PUE of 1.3 means for every 1 kW of compute, you pay for 1.3 kW total. The extra 0.3 kW covers cooling, lighting, power distribution losses, and other facility overhead.
| GPU | IT Power (kW) | PUE | Electricity Rate (¢/kWh) | Cost/hr |
|---|---|---|---|---|
| RTX PRO 6000 SE | 6.8 | 1.3 | 13.41 | $1.19 |
| H100 | 10.2 | 1.3 | 13.41 | $1.78 |
| H200 | 10.2 | 1.3 | 13.41 | $1.78 |
| B200 | 14.3 | 1.3 | 13.41 | $2.49 |
Notes:
- Electricity Rate (13.41¢/kWh) is the average US commercial rate as of November 2025 (source: EIA)
- The 6.8kW TDP is for the RTX PRO 6000 server edition 8-GPU server. The server based on RTX PRO 6000 Max-Q would have lower power consumption (~4Kw) but also lower performance.
Formula:

Note on power differences: The H100, H200, and B200 figures assume DGX-class systems with higher overall specs compared to RTX PRO 6000 SE workstations. Key differences include:
- NVSwitch fabric: DGX systems use 4 NVSwitch chips for high-bandwidth GPU-to-GPU communication, adding ~400-600W
- Dual server-class CPUs: Xeon/EPYC processors (300-400W each) vs single workstation CPU
- More system RAM: 2TB+ vs typical workstation configurations
- High-speed networking: InfiniBand/400GbE adapters
For a more apples-to-apples comparison with similar server specs (no NVSwitch), subtract ~4-5 kW from the datacenter GPU figures.
We use PUE = 1.3, which is typical for an efficient colocation facility (source: nrel.gov). For reference:
- 1.1–1.2: Hyperscale datacenters (Google, Meta)
- 1.3–1.4: Efficient colocation / well-designed facilities
- 1.5–2.0: Older or less efficient facilities
2. Depreciation
Computational hardware rapidly loses value over time due to wear-and-tear and release of new more performant and efficient models. We assume a 4-year useful life with a 10-20% salvage value at the end of life.
Formula:

| GPU | System Capex | Salvage | Life (years) | Depreciation $/hr |
|---|---|---|---|---|
| RTX PRO 6000 SE | $105,000 | 50% | 4 | $1.50 |
| H100 | $240,000 | 20% | 4 | $5.48 |
| H200 | $290,000 | 30% | 4 | $5.79 |
| B200 | $375,000 | 30% | 4 | $7.49 |
How this works:
- Capex is the full 8-GPU system cost (server, GPUs, networking, etc.)
- Salvage value is the estimated resale value at end of life (varies by GPU class)
- 8760 = hours per year (24 × 365), assuming 100% utilization
- Example (H100): ($240,000 × 0.8) / (4 × 8760) = $192,000 / 35,040 = $5.48/hr
Notes on prices and depreciation rates:
- Depreciation numbers are provided by DC operators. 50% for the Pro6000 server is conservative given that the A6000 has lost just 10-15% of its value after 5 years, and the 6000Ada lost 20% after 2.5 years.
- The prices above are from Exxact / Supermicro for 'modest' specs, except for the Pro6000, which is the average of NeuralRack / Supermicro
- Datacenter GPUs decline in value faster due to more frequent release cycle and higher initial cost.
3. Cost of Capital
Typically, you would buy hardware using a business loan, and we need to account for the cost of the loan. We model this as total interest paid on a loan, spread across operating hours. Established companies with access to cheaper capital (5-10%) would see significantly lower costs
If you have capital, this cost is effectively zero. However, you would be foregoing potential returns from investing that capital elsewhere, so it represents an opportunity cost.
| GPU | Capex | Total Interest (4yr @ 20% APR) | Interest $/hr |
|---|---|---|---|
| RTX PRO 6000 SE | $105,000 | $48,369 | $1.38 |
| H100 | $240,000 | $110,557 | $3.16 |
| H200 | $290,000 | $133,590 | $3.81 |
| B200 | $375,000 | $172,746 | $4.93 |
How this works:
- Cost of capital represents the financing cost of purchasing hardware via a loan
- 20% APR amortized over 4 years (matching the depreciation life), with equal monthly payments
- Total interest is computed using Bankrate loan calculator using standard amortization formula.
- Total interest is divided by total hours (4 × 8760 = 35,040)
- Example (H100): $110,557 total interest / 35,040 hours = $3.16/hr
4. Spares
Spare parts and support contracts scale with system value as a percentage of capex:

| GPU | Capex | Spares % | $/hr |
|---|---|---|---|
| RTX PRO 6000 SE | $105,000 | 4% | $0.48 |
| H100 | $240,000 | 4% | $1.10 |
| H200 | $290,000 | 4% | $1.32 |
| B200 | $375,000 | 4% | $1.71 |
We decided to keep spares at 4% of capex annually across all GPU classes. Datacenter GPUs have better warranty and support options, but operators report that their failure rates are higher due to higher thermal stress and complex HBM memory.
5. Colocation
For AI cabinets, power is the limiting factor and the primary cost driver—not rack units. Colocation providers price capacity per kW of peak IT power. The market average for Tier 3 facilities is $170–200/kW/month; we use $185/kW/month. These are per-server costs; bulk deployments achieve better rates.

| GPU | IT Power | Colo $/month | Colo $/hr |
|---|---|---|---|
| RTX PRO 6000 SE | 6.8 kW | $1,258 | $1.72 |
| H100 | 10.2 kW | $1,887 | $2.58 |
| H200 | 10.2 kW | $1,887 | $2.58 |
| B200 | 14.3 kW | $2,646 | $3.62 |
6. Fixed operational costs
These costs are roughly the same regardless of GPU type. Network costs scale with bandwidth needs; 10Gbps is typical for inference workloads
| Cost Item | Monthly | $/hr |
|---|---|---|
| Network (10Gbps) | $500 | $0.68 |
| Remote hands | $150 | $0.21 |
| Insurance & misc | $200 | $0.27 |
| Total | $850 | $1.16 |
Complete run cost breakdown
Combining all six components, here are the total run-cost estimates for 8-GPU systems:
| Cost Component | RTX PRO 6000 SE | H100 | H200 | B200 |
|---|---|---|---|---|
| Electricity | $1.19 | $1.78 | $1.78 | $2.49 |
| Depreciation | $1.50 | $5.48 | $5.79 | $7.49 |
| Cost of Capital | $1.38 | $3.16 | $3.81 | $4.93 |
| Spares | $0.48 | $1.10 | $1.32 | $1.71 |
| Colocation | $1.72 | $2.58 | $2.58 | $3.62 |
| Fixed Ops | $1.16 | $1.16 | $1.16 | $1.16 |
| 8×GPU Server $/hr | $7.43 | $15.26 | $16.44 | $21.40 |
| Per GPU $/hr | $0.93 | $1.91 | $2.06 | $2.68 |
Note on utilization: These estimates assume 100% utilization (8760 hours/year). If your actual utilization is lower, divide by your utilization rate—e.g., at 80% utilization, effective costs are ~25% higher.
These run-cost estimates provide a stable baseline for infrastructure decisions that won't fluctuate with cloud market dynamics. Use them to evaluate whether self-hosting makes sense for your specific workloads and scale.
Acknowledgments
Thanks to the NeuralRack owner for providing up-to-date hardware pricing, depreciation and colocation cost data for this analysis. Check out their pricing calculator to estimate your own GPU server price.